
Amateur Radio Logging
Amateur radio logging is extremely data focused. Given the plethora of logging programs, it is surprising that few focus on the underlying data underlying structure. In SWLog all data is stored in a relational database (Microsoft SQL Server), thus providing enterprise-grade data capabilities.
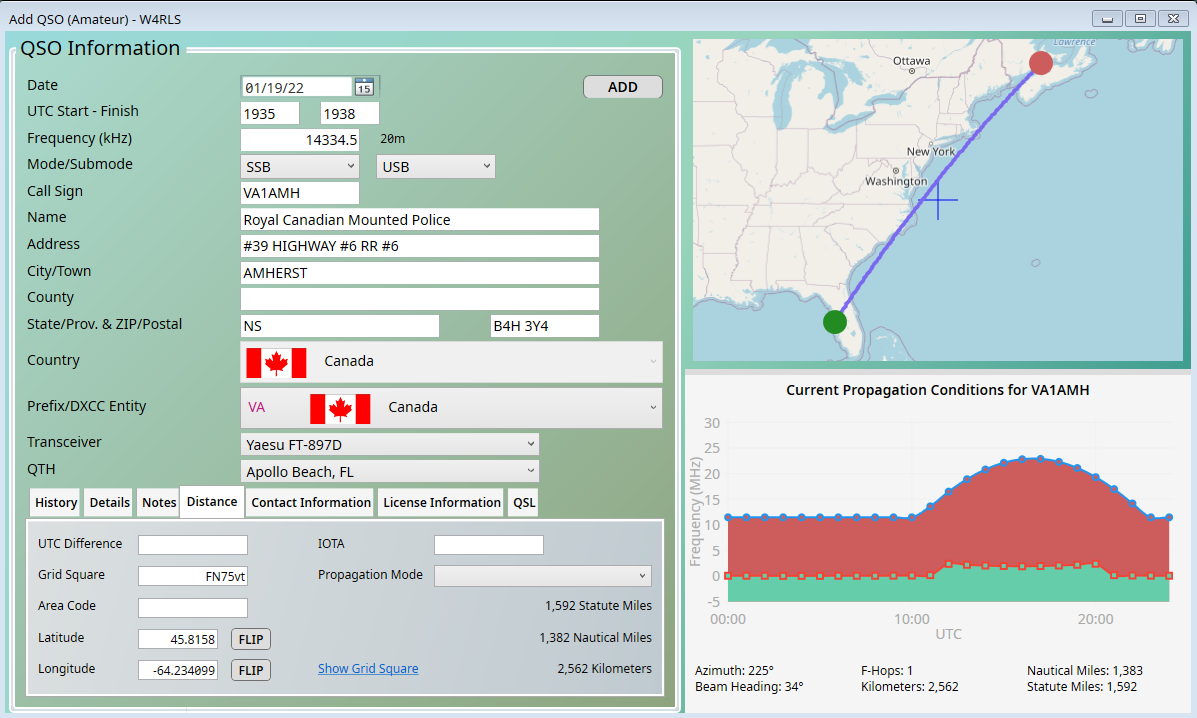
Add Log (Standard)
The standard data entry form allows for the entry and editing over over 100 data points for a QSO. It also provides an interface to send an electronic QSL card.
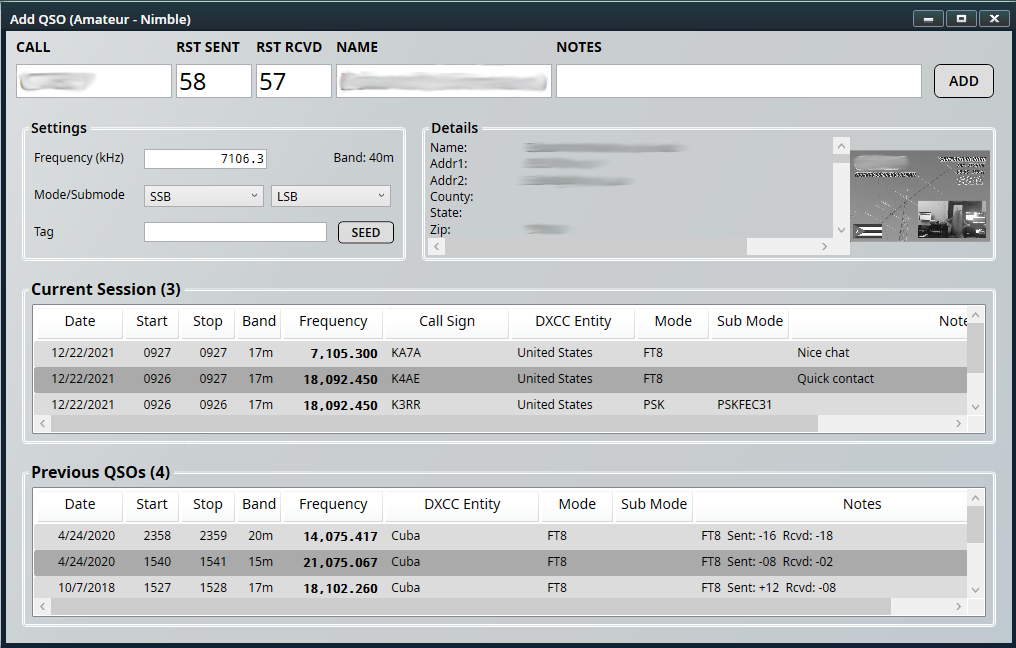
Add Log (Nimble)
Nimble is a more streamlined form that seamlessly integrates with the Radio Control (Desktop) or the Radio Control Server applications to keep the frequency aligned as the radio is tuned. Full detail lookups to QRZ.com or the downloaded FCC Amateur or Canadian Amateur databases will automatically populate details based upon the call sign.
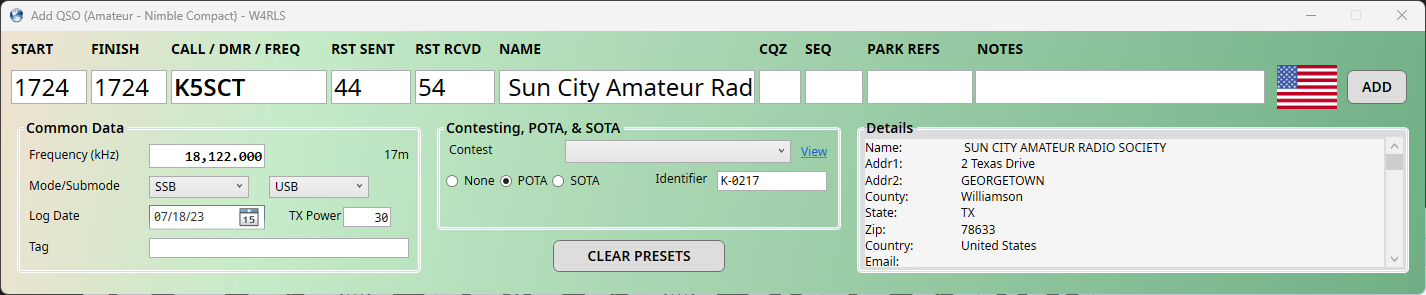
Add Log (Nimble Compact)
Nimble can also run in a compact mode to quickly and simply add QSOs.
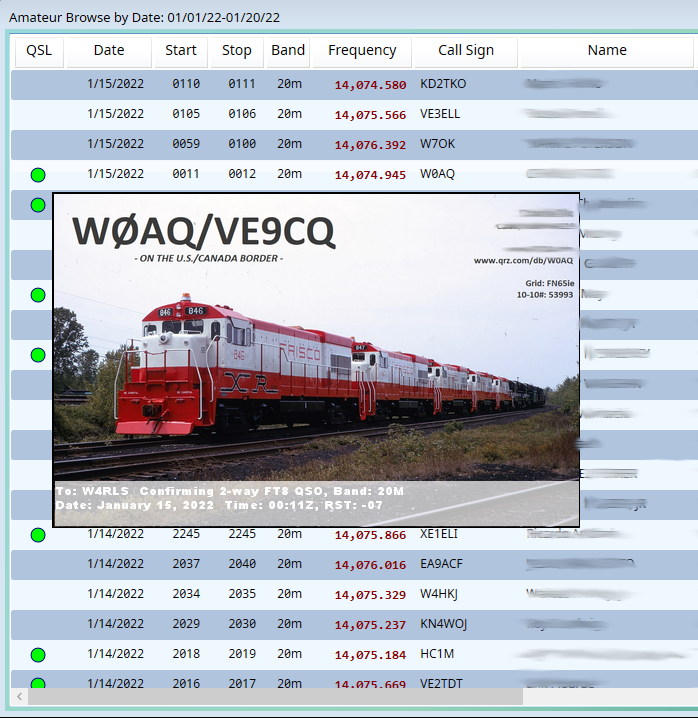
Browsing Logs
When browsing logs, the logs can be viewed flat or grouped by various columns, like this example where the logs are grouped by country. If there is a QSL card that has been processed locally (i.e. a scan of a physical QSL card) or downloaded form eQSL.cc, it will be dynamically displayed in-line. While this data isn't technically PII as it is publicly available, the names and addresses have been blurred as there is no reason to show that data.
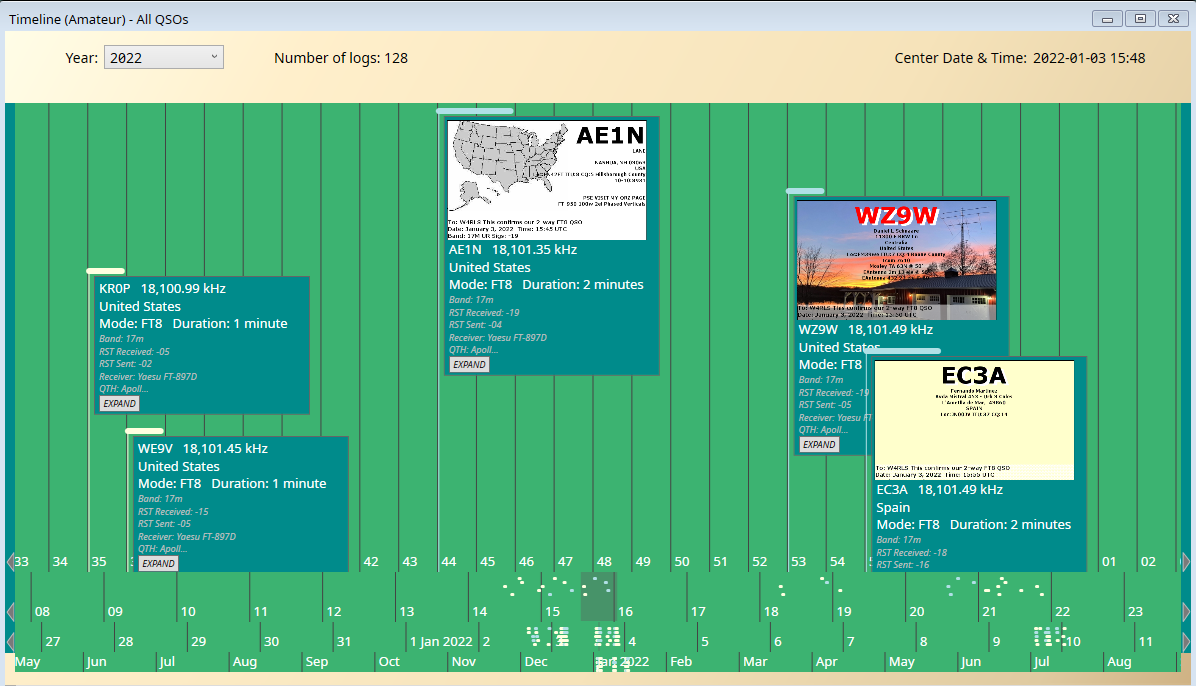
Time Line
The time line view shows each QSO chronologically as in a historical time line along the x-axis. Each QSO is represented by a dot in the year, month, or day row.
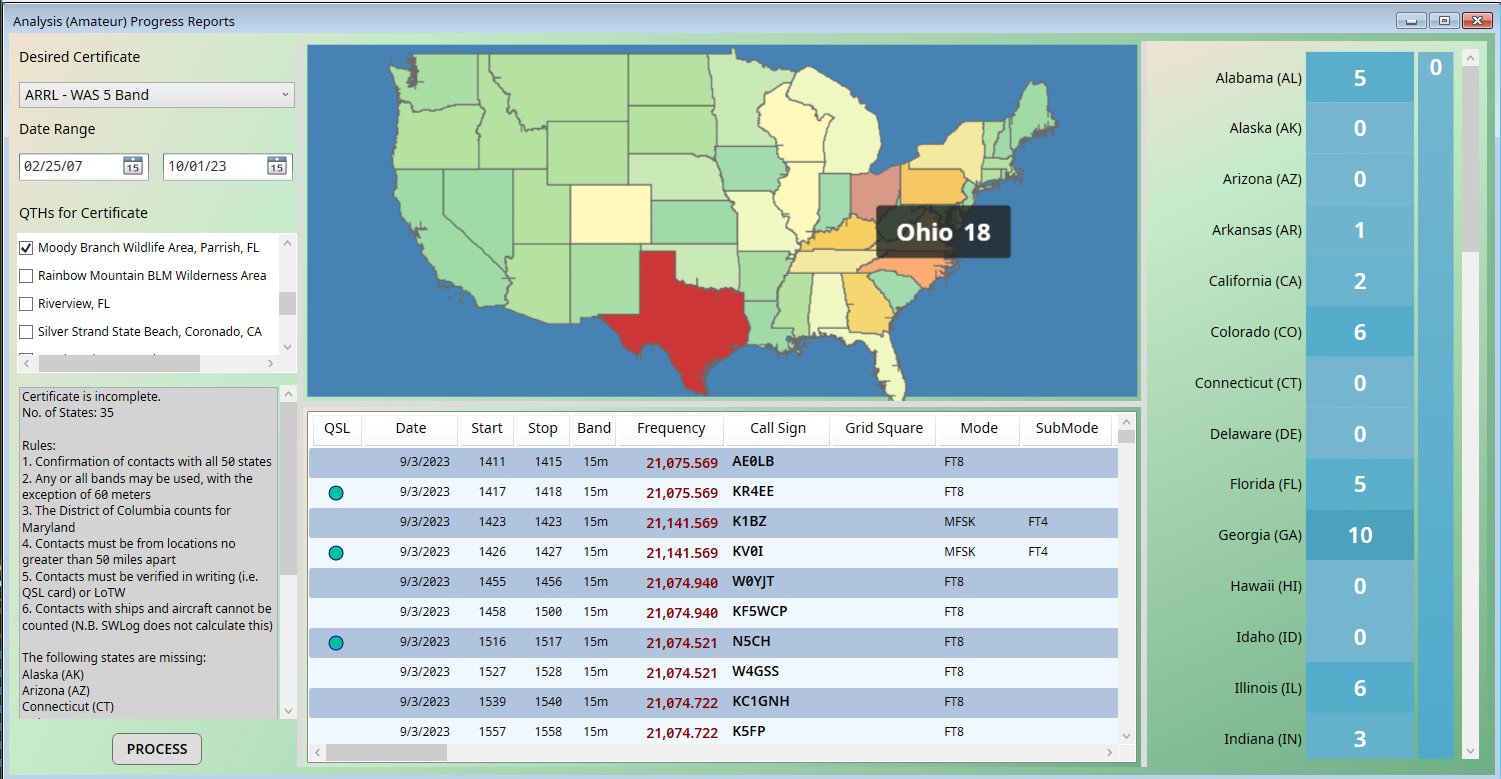
Progress Reports
The progress toward various certificates and goals can be easily tracked and mapped.
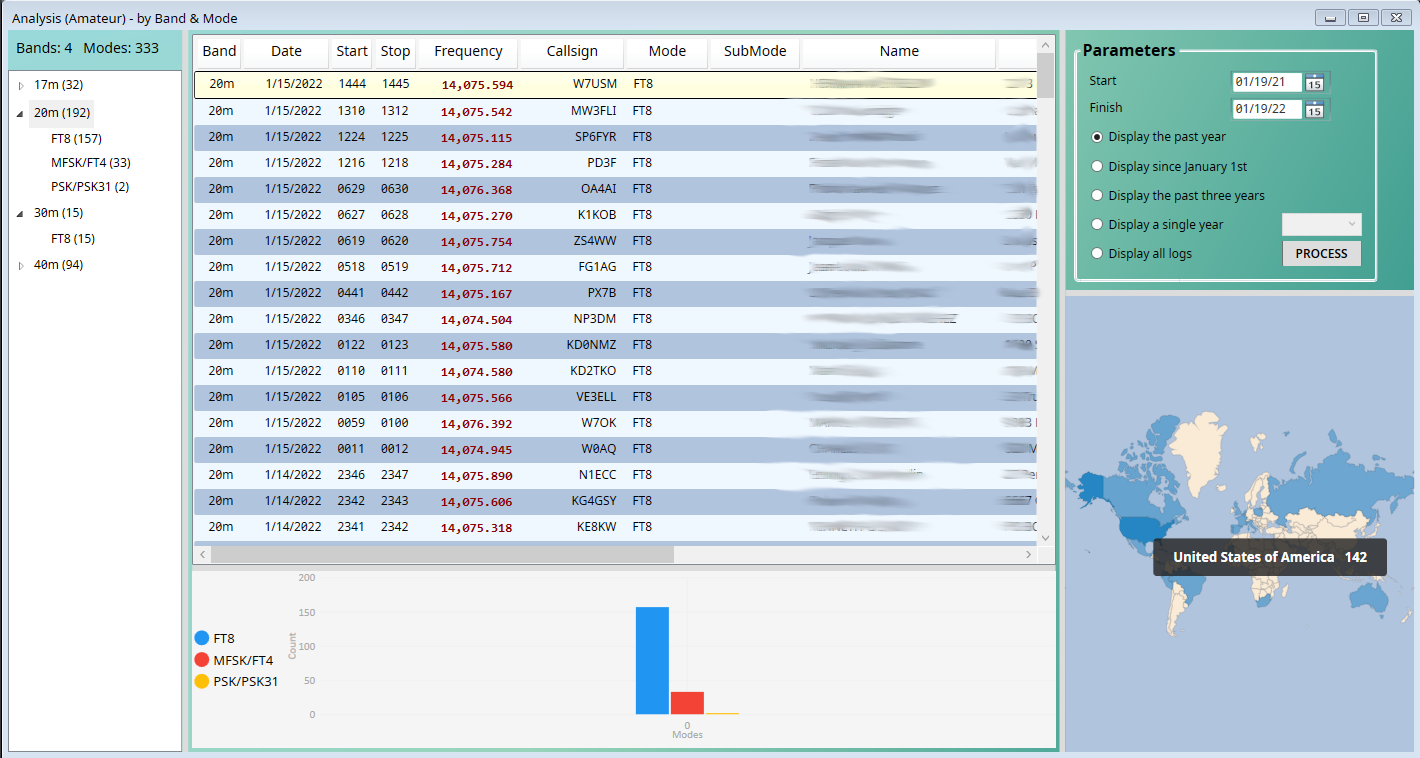
Analysis by Mode
What is the point of having thousands of logs without any perspective or analysis? SWLog provides many ways to slice and dice the data. In this example, the number and modes for logs in the 20m band over the past year are shown with a heat map by country.
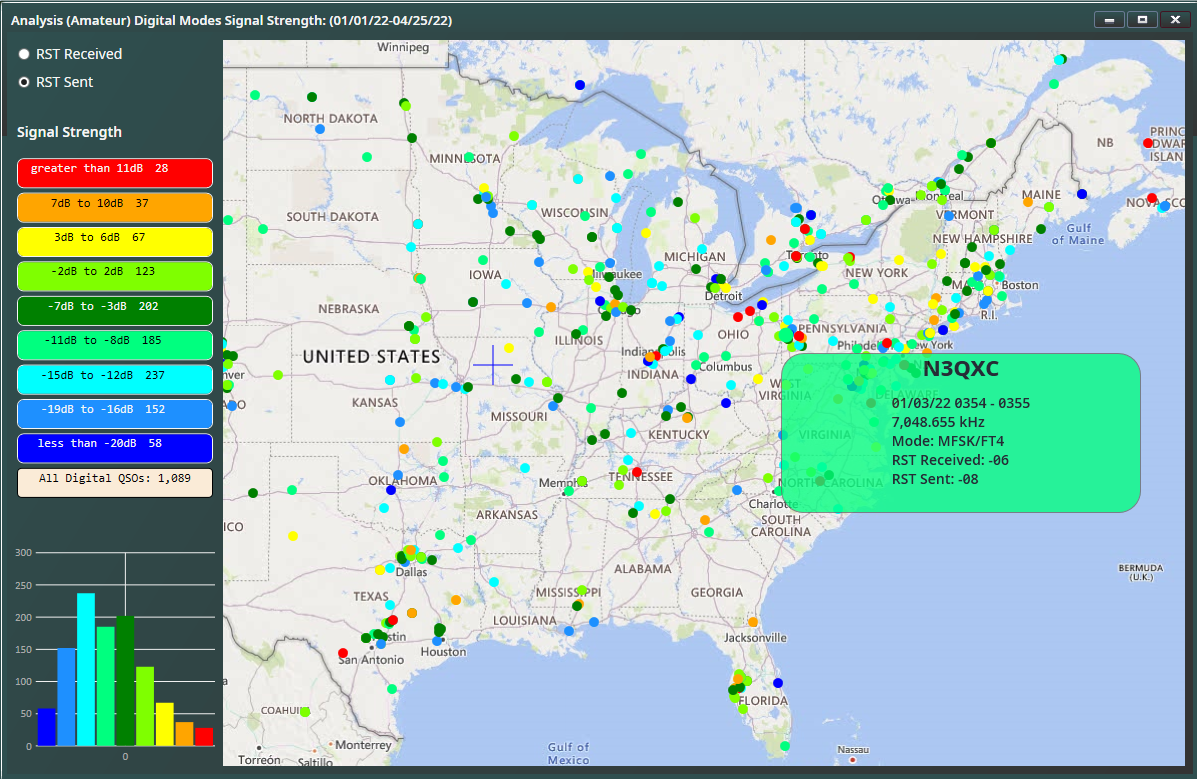
Analysis for Digital Modes
With FT8 and MFSK/FT4 having significant popularity, SWLog provides the ability to analyze these digital modes by signal strength and band, providing details on how transmissions are being received.
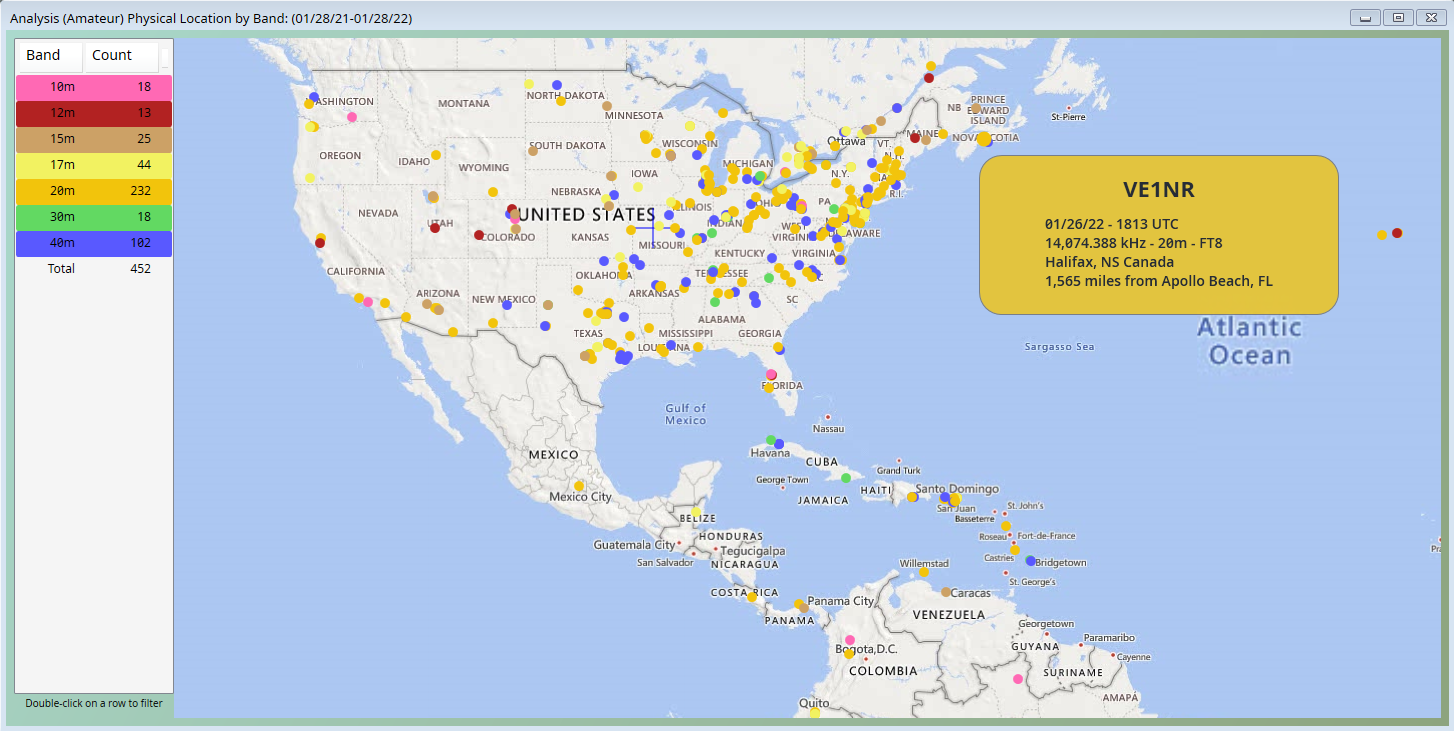
Analysis by Location and Band
A straightforward, but useful, view is simply to plot all QSOs on a map with a different color by band.
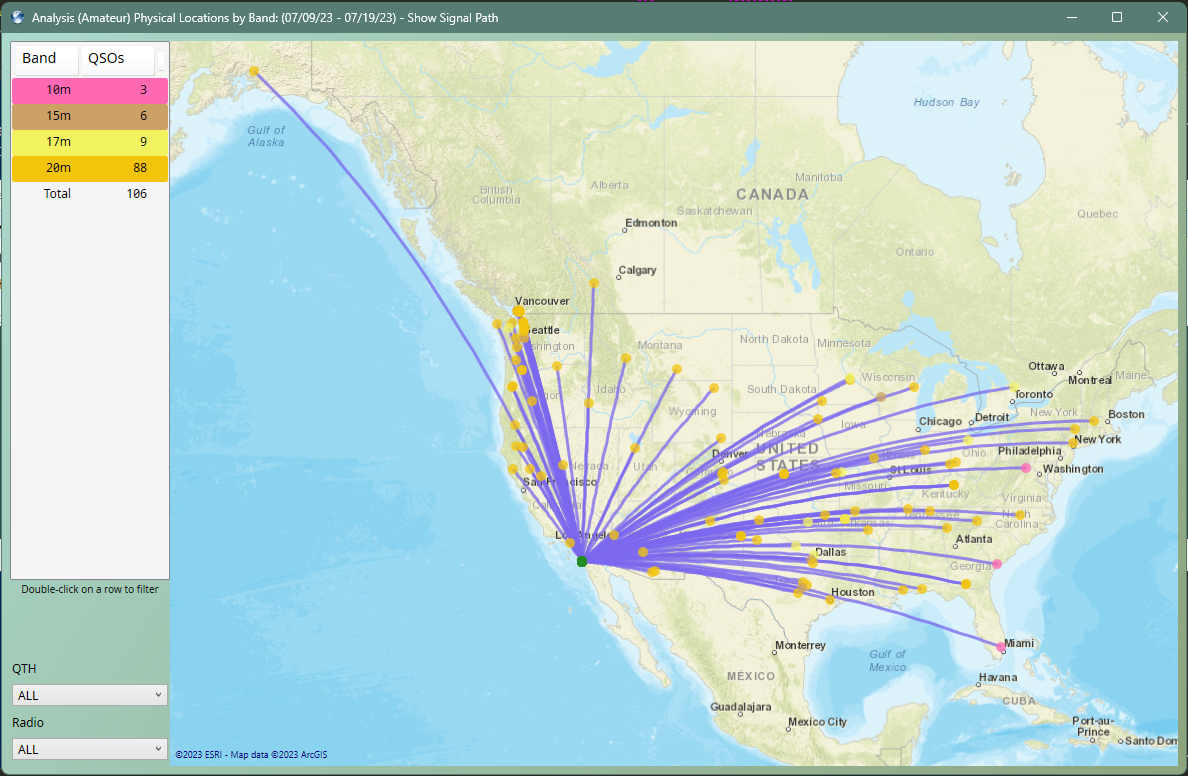
Analysis by Signal Path
The ability to view QSO and the signal path can show interesting results. This is particularly useful for POTA activations.
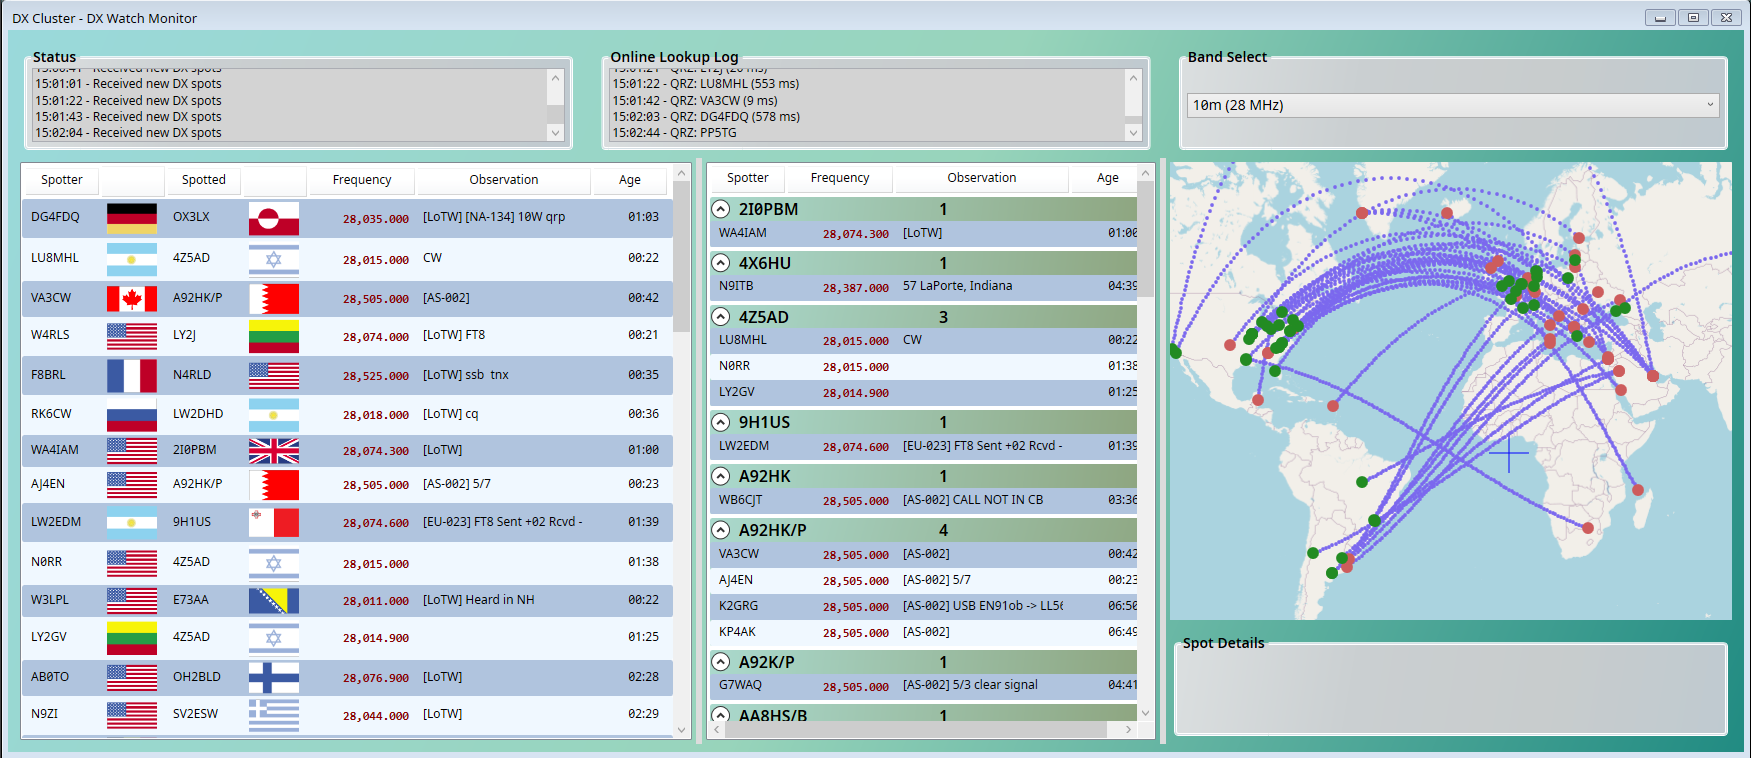
Cluster Monitoring
DX Clusters provide current, real-time insight into current propagation conditions and if any rare DX stations have been spotted. SWLog currently supports the DX Watch and QRZCQ clusters.
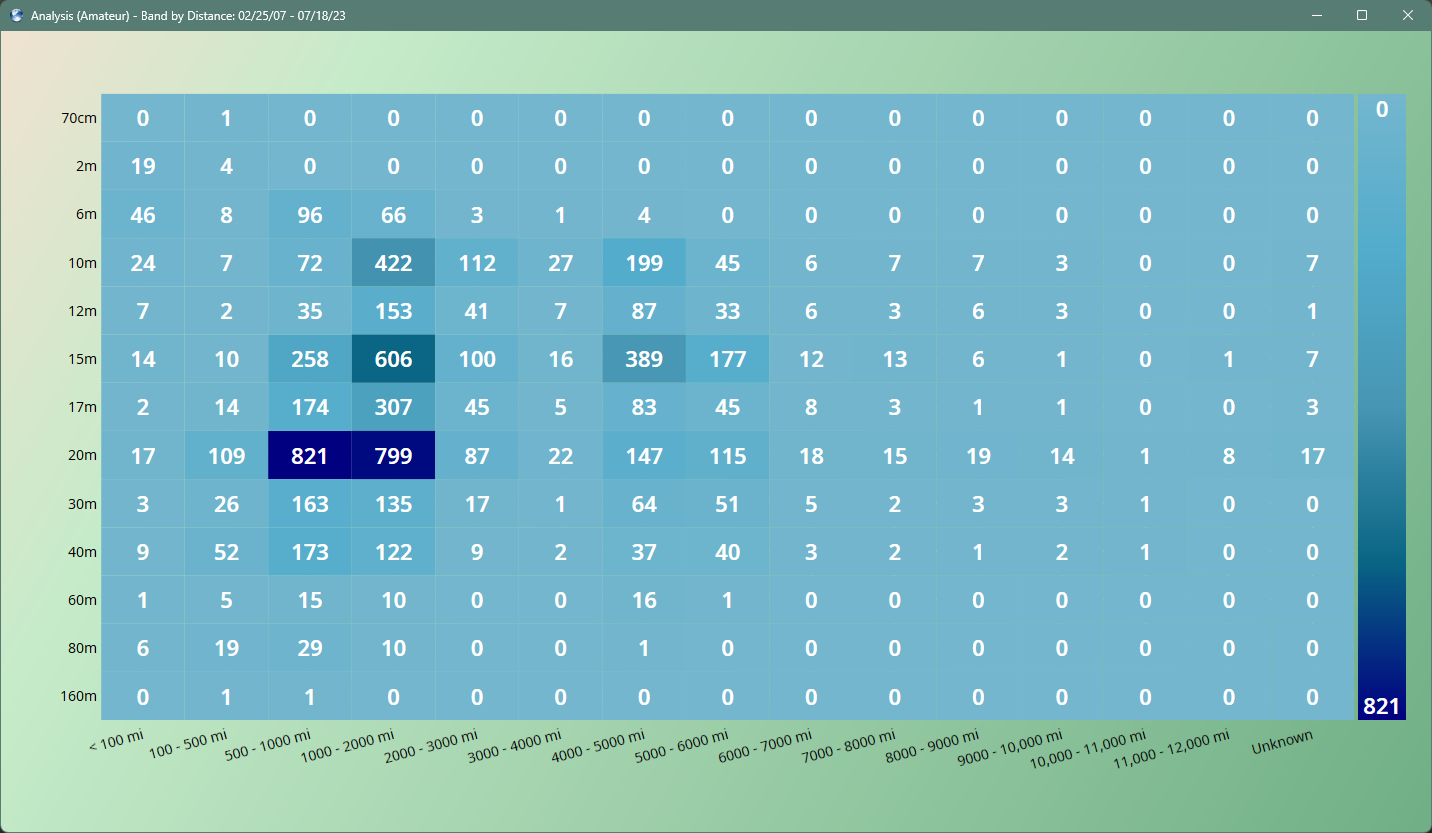
Heat Maps 1
Heat maps provide a simple representation of data over specific categories. In this example, QSOs are compared by band and distance. Evidentally it is all about 20 meters!
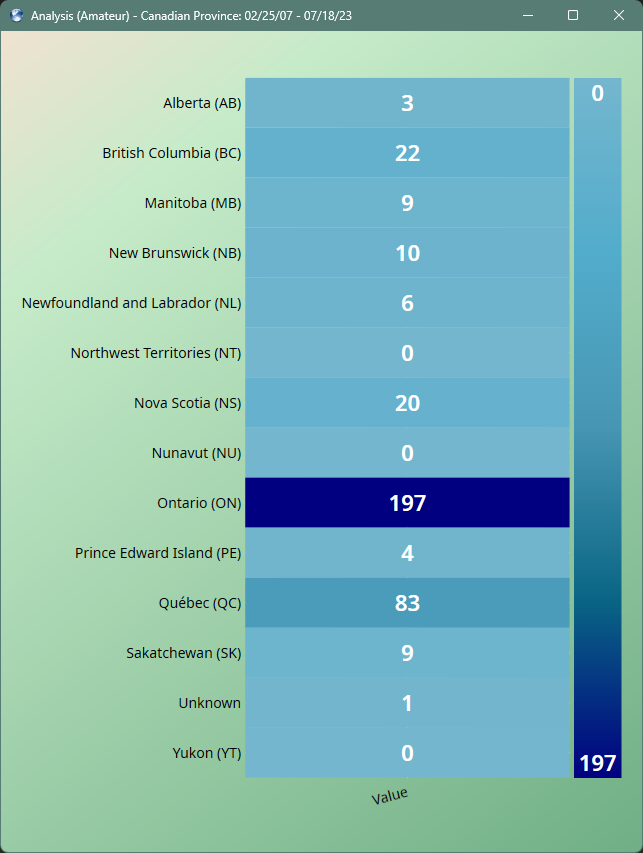
Heat Maps 2
In this example, all QSOs with Canada are displayed in a heat map. Many more examples are available in SWLog.
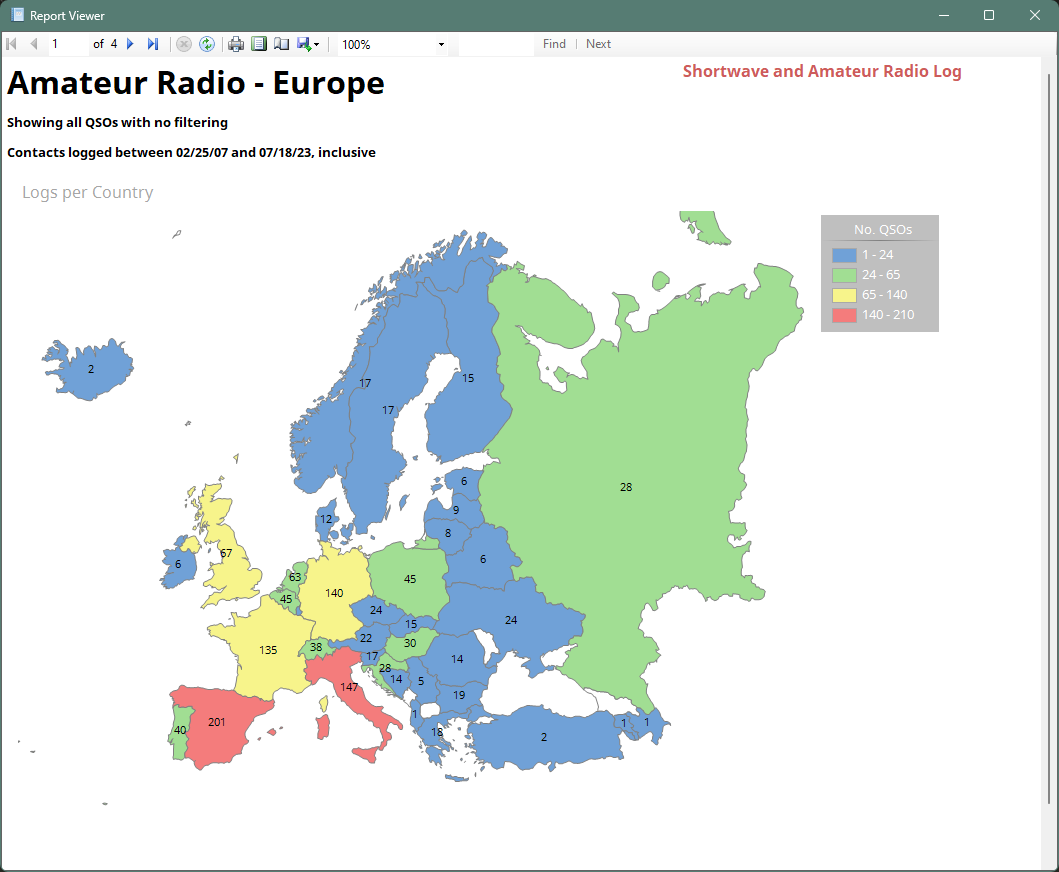
QSOs by Country
A form of heat maps is also provided to GIS maps, such as showing the number of QSOs for each country in Europe. This can also be filtered by date range, mode, and other filters.
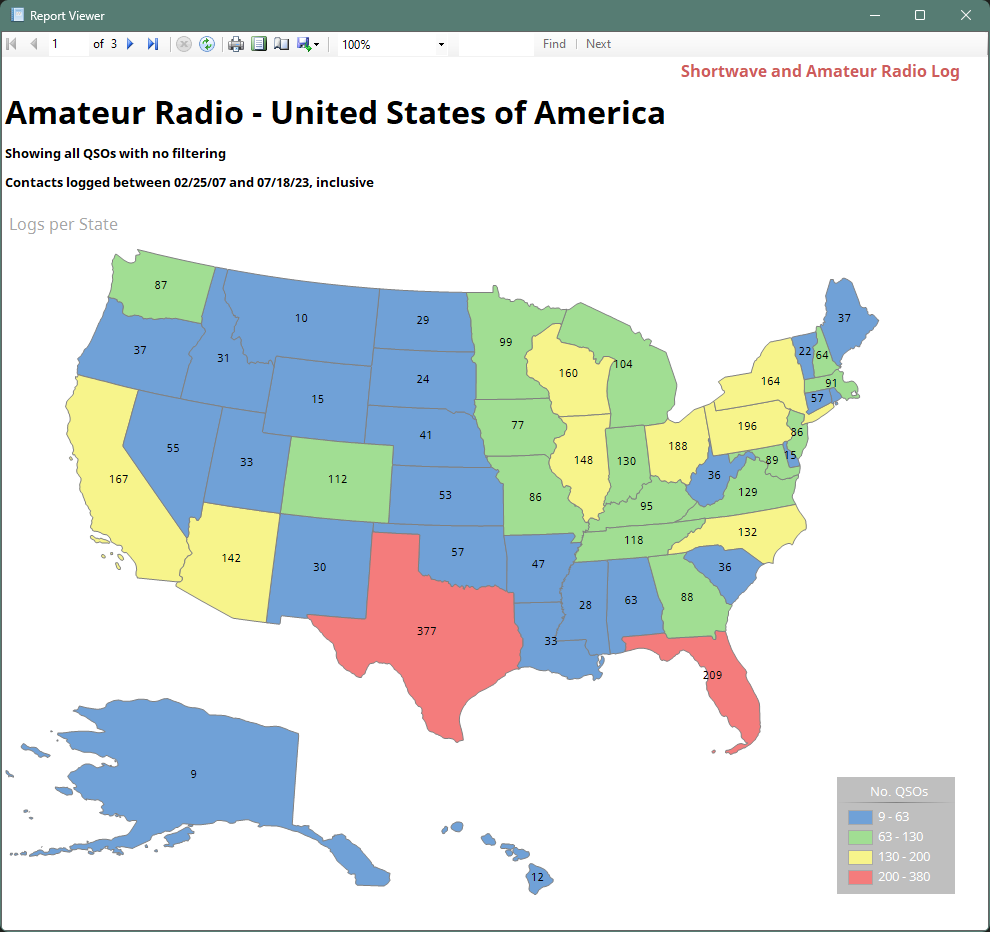
QSOs by State/Province
For the United States of America, Canada, and Australia, QSOs can further be viewed by state or province.
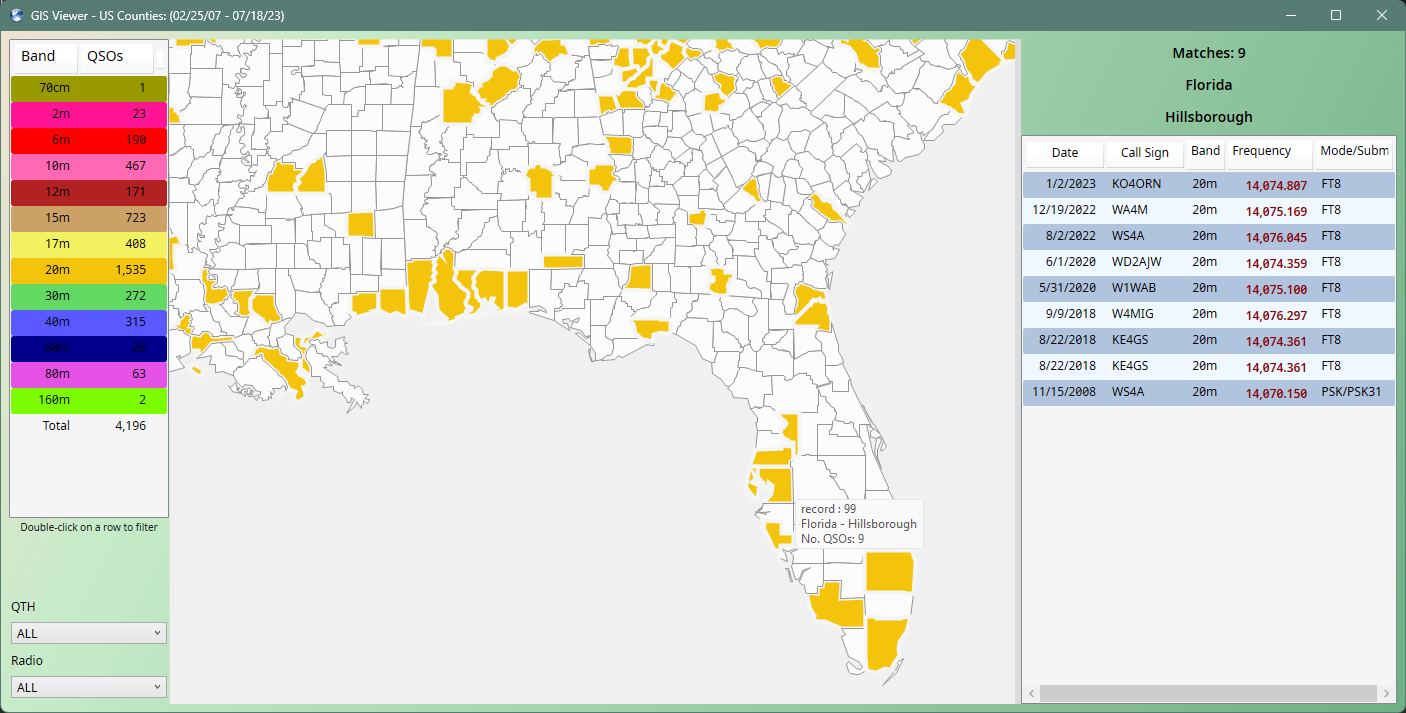
QSOs by US County
If viewing QSOs by State is not granular enough, QSOs can be viewed and dynamically filtered by county, band, QTH, and radio.
This example shows QSOs for Hillsborough County, Florida on 20 meters.
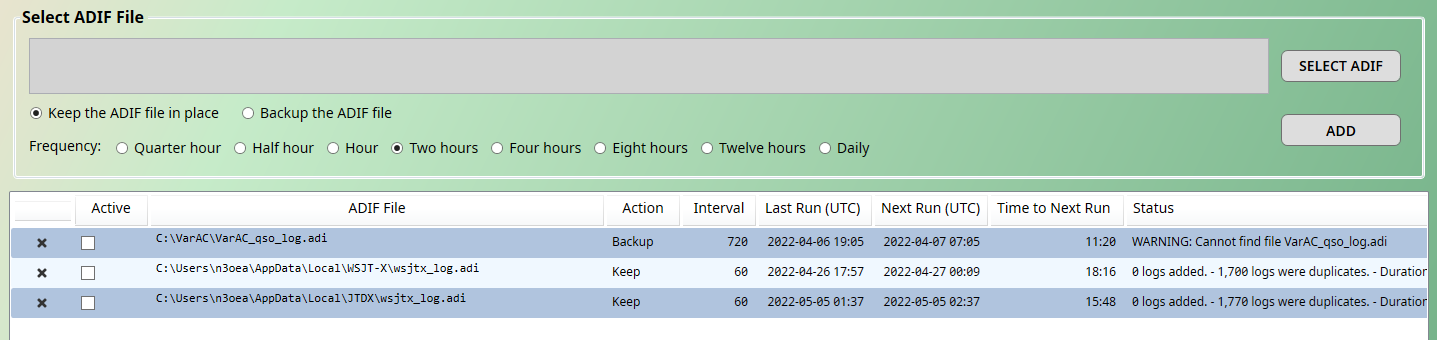
ADIF Import/Export
ADIF, while having a peculiar structure, is the method of data exchange between amateur programs. SWLog supports importing and exporting data via ADIF. Additionally the importing of data via ADIF can be scheduled on a recurring basis.
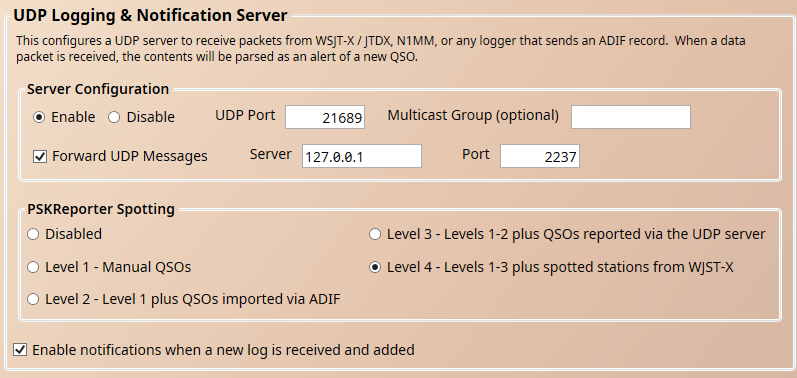
UDP Server
The UDP Server can receive QSO packets from WSJT-X and variants plus N1MM or any logger that sends ADIF packets. Additionally broadcast and status packets from WSJT-X and variants are received and processed. Included is the ability to forward the UDP packets to another program and to PSKReporter.
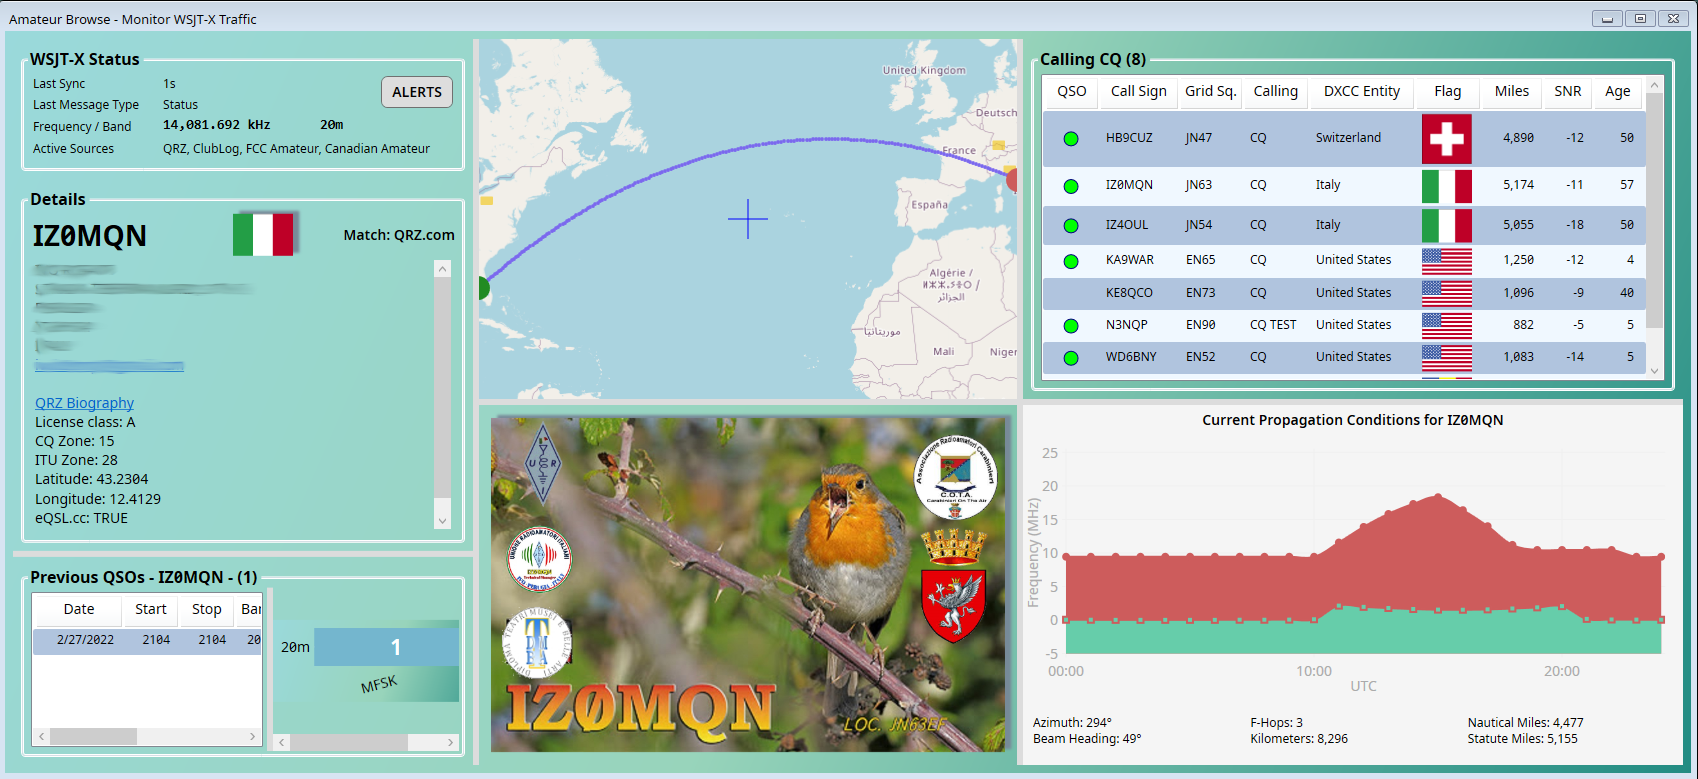
WSJT-X Monitoring
The status packets from WSJT-X can be processed in real-time to show detailed information about QSO including any previous QSOs, the default image on QRZ.com, current propagation conditions to the station, and the path and distance.
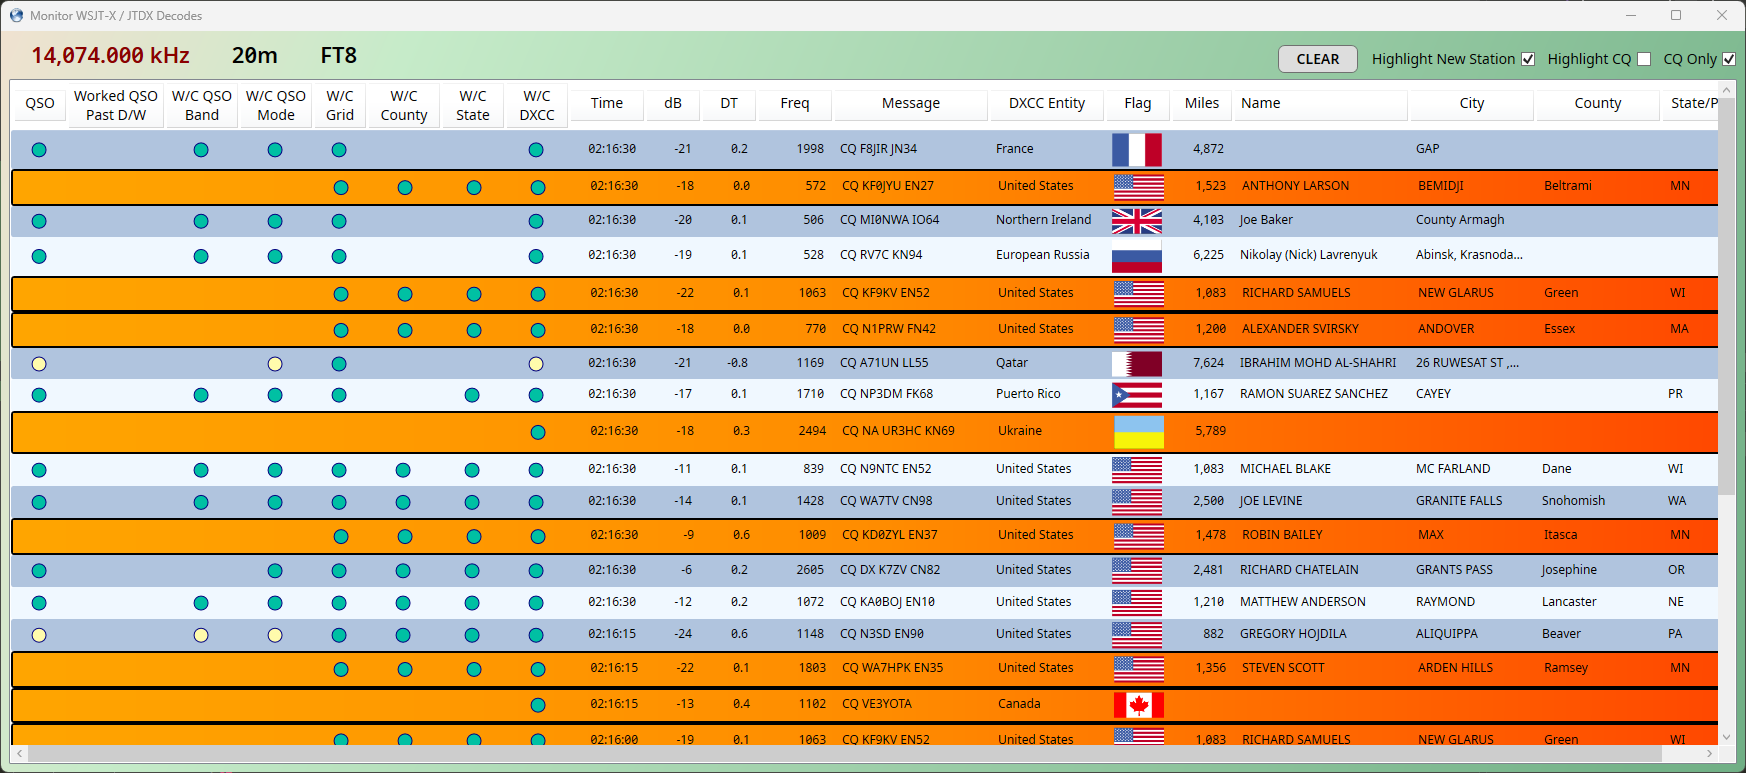
WSJT-X Traffic
The decoded UDP packets from WSTJ-X can be viewed with specific log-centric details
- QSO worked/confirmed
- QSO in the past day or week
- QSO worked/confirmed on band
- QSO worked/confirmed with mode
- Grid square worked/confirmed
- US County worked/confirmed
- US State or Canadian Province worked/confirmed
- DXCC Entity worked/confirmed
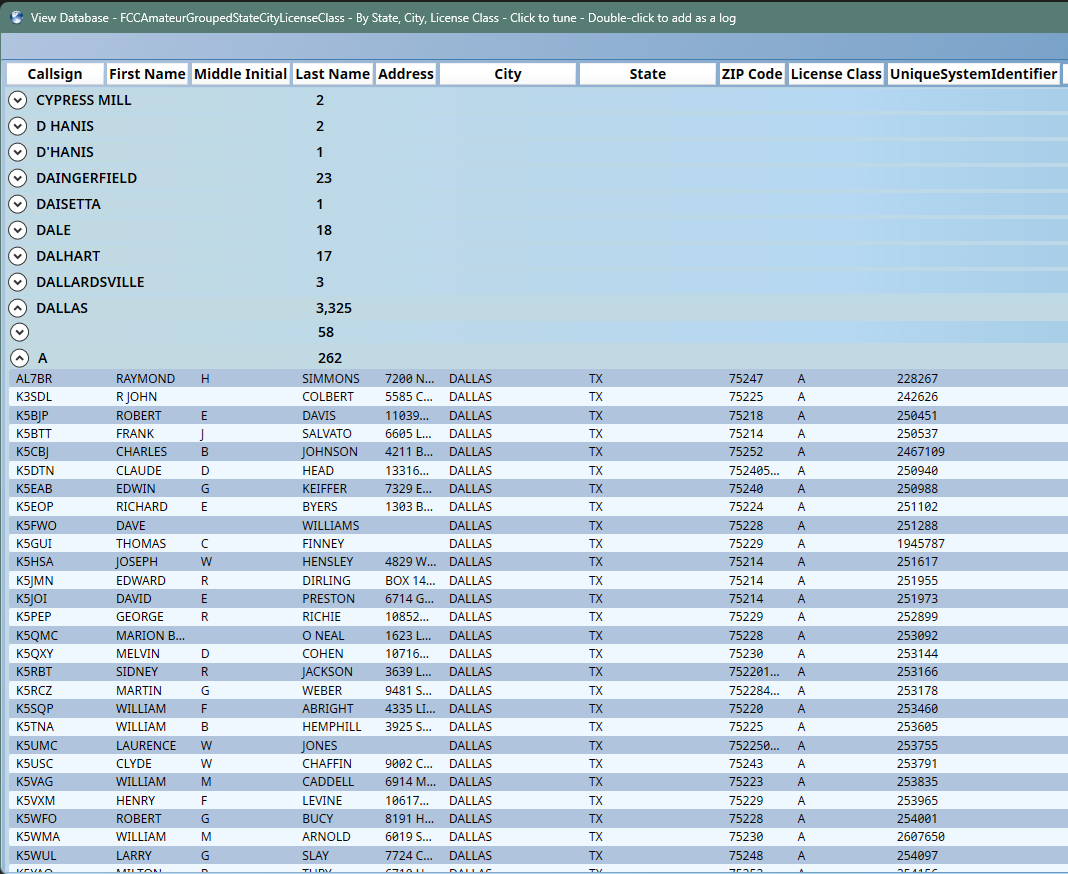
Off Grid Lookups
The FCC Amateur, Canadian Amateur, and DMR databases can be downloaded into the local database and used for off-the-grid lookups with no Internet connectivity.